
.svg)
Data Visualisation Tools Every Agency Needs
.svg)
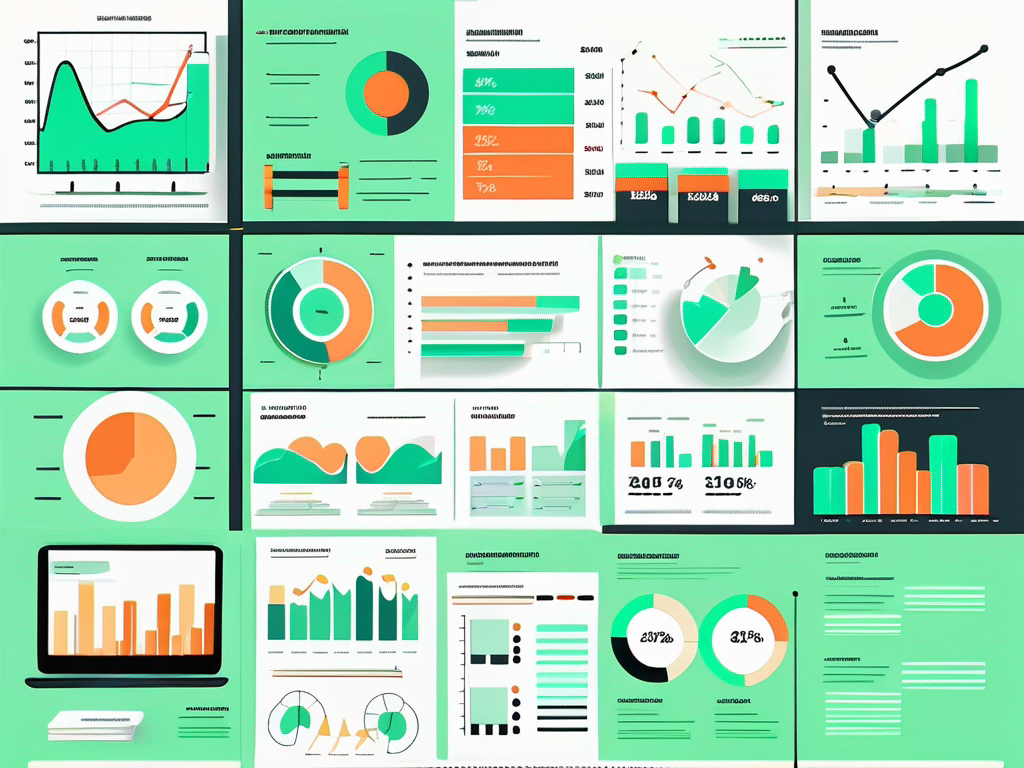
In today's data-driven world, the ability to transform raw data into meaningful insights is crucial for agencies striving to stay ahead of the competition. Data visualisation tools have become indispensable in helping agencies interpret complex data sets, communicate findings effectively, and make informed decisions. With a plethora of options available, choosing the right tools can be daunting. This guide explores essential data visualisation tools that every agency should consider integrating into their workflow.
Understanding the Importance of Data Visualisation
Data visualisation is more than just creating attractive charts and graphs. It is about presenting data in a way that is both accessible and understandable, enabling stakeholders to grasp complex information quickly. Effective data visualisation can reveal patterns, trends, and outliers that might otherwise go unnoticed in raw data.
For agencies, the ability to visualise data effectively can enhance client presentations, improve internal decision-making processes, and provide a competitive edge. By turning data into a visual narrative, agencies can tell compelling stories that resonate with clients and stakeholders alike.
Moreover, as data becomes increasingly complex and voluminous, the need for sophisticated visualisation tools that can handle large data sets and provide real-time insights is more critical than ever. Agencies must equip themselves with the right tools to harness the full potential of their data.
Top Data Visualisation Tools for Agencies
Tableau
Tableau is renowned for its user-friendly interface and powerful capabilities, making it a favourite among agencies of all sizes. It allows users to create interactive and shareable dashboards, which can be customised to suit specific client needs. Tableau's drag-and-drop functionality simplifies the process of creating complex visualisations, making it accessible to users with varying levels of technical expertise.
One of Tableau's standout features is its ability to connect to a wide range of data sources, from spreadsheets to cloud services, enabling seamless data integration. This flexibility ensures that agencies can work with the data they already have, without the need for extensive reformatting or restructuring.
Additionally, Tableau offers robust analytical capabilities, allowing users to perform in-depth data analysis and uncover insights that drive strategic decision-making. Its vibrant community and extensive resources make it easy for agencies to get support and learn best practices.
Power BI
Microsoft's Power BI is another popular choice for agencies looking to enhance their data visualisation capabilities. Known for its integration with other Microsoft products, Power BI provides a seamless experience for agencies already using tools like Excel and Azure. Its intuitive interface and powerful analytics features make it a versatile option for agencies of all sizes.
Power BI's real-time data access and interactive dashboards allow agencies to monitor key metrics and performance indicators as they happen. This real-time capability is particularly beneficial for agencies that need to make quick, data-driven decisions.
Furthermore, Power BI's collaboration features enable teams to work together on data projects, ensuring that insights are shared and acted upon efficiently. With its robust security measures, agencies can also rest assured that their data is protected.
Google Data Studio
Google Data Studio offers a free, cloud-based solution for agencies looking to create dynamic and interactive reports. Its integration with other Google products, such as Google Analytics and Google Ads, makes it an attractive option for agencies already invested in the Google ecosystem.
One of the key advantages of Google Data Studio is its customisability. Agencies can create tailored reports that meet the specific needs of their clients, using a wide array of visualisation options. This flexibility allows agencies to present data in a way that is both engaging and informative.
Google Data Studio also supports collaboration, enabling team members to work together on reports in real-time. This feature is particularly useful for agencies with remote teams or those working across different locations.
Features to Consider When Choosing a Data Visualisation Tool
Ease of Use
When selecting a data visualisation tool, ease of use should be a top consideration. Agencies need tools that can be quickly adopted by team members, regardless of their technical expertise. A user-friendly interface and intuitive design can significantly reduce the learning curve and increase productivity.
Tools that offer drag-and-drop functionality, pre-built templates, and guided tutorials can help agencies get up and running quickly. This ease of use ensures that team members can focus on analysing data and generating insights, rather than struggling with complex software.
Integration Capabilities
Integration capabilities are another crucial factor to consider. Agencies often work with data from multiple sources, including CRM systems, social media platforms, and cloud services. A data visualisation tool that can seamlessly integrate with these sources will save time and reduce the risk of errors associated with manual data entry.
Look for tools that offer a wide range of connectors and APIs, allowing for easy data import and export. This flexibility ensures that agencies can work with the data they need, without being constrained by the limitations of their visualisation tool.
Scalability and Performance
As agencies grow and their data needs evolve, scalability becomes an important consideration. A data visualisation tool should be able to handle increasing volumes of data without compromising performance. This scalability ensures that agencies can continue to derive insights from their data, even as their operations expand.
Performance is also critical, particularly for agencies that require real-time data analysis. Tools that offer fast processing speeds and responsive dashboards will enable agencies to make timely, data-driven decisions.
Maximising the Benefits of Data Visualisation Tools
Training and Support
To maximise the benefits of data visualisation tools, agencies should invest in training and support for their teams. Providing team members with the skills and knowledge they need to use these tools effectively will ensure that agencies can fully leverage their capabilities.
Many data visualisation tools offer extensive resources, including tutorials, webinars, and community forums. Agencies should take advantage of these resources to help their teams stay up-to-date with the latest features and best practices.
Customisation and Personalisation
Customisation and personalisation are key to creating impactful data visualisations. Agencies should look for tools that allow them to tailor visualisations to meet the specific needs of their clients. This customisation can include everything from choosing the right chart types to designing bespoke dashboards.
By personalising data visualisations, agencies can ensure that their insights resonate with clients and stakeholders, ultimately leading to more successful outcomes.
Continuous Evaluation and Improvement
Finally, agencies should continuously evaluate and improve their data visualisation processes. This evaluation should include regular reviews of the tools being used, as well as the effectiveness of the visualisations being produced.
By seeking feedback from clients and stakeholders, agencies can identify areas for improvement and make necessary adjustments. This continuous improvement will help agencies stay at the forefront of data visualisation and maintain their competitive edge.
Conclusion
Data visualisation tools are essential for agencies looking to harness the power of their data and communicate insights effectively. By choosing the right tools and investing in training and support, agencies can transform their data into a valuable asset that drives strategic decision-making and delivers tangible results. Whether it's through the intuitive interface of Tableau, the real-time capabilities of Power BI, or the customisability of Google Data Studio, there is a data visualisation tool to meet the needs of every agency.


Let's
Let’s discuss how we can bring reinvigorated value and purpose to your brand.
.svg)